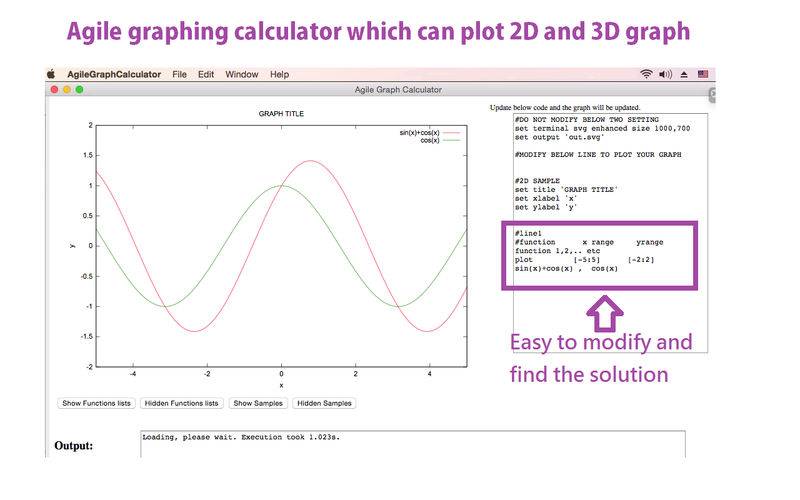
It is a very powerful scientific graphing calculator which can plot 2D and 3D graph.
It also support many commands for set different color and width of the line.
Features:
plot 2D and 3D graph
plot multiple functions on one graph
can operate on very large number mathematics.
User can set the different color and width of the line. Other features which may be customized using the set command are: arrow, border, clip, contour, grid, mapping, polar, surface, time, view, and many more.
It can compute factorial and fibonacci number.
Support many trigonometric functions
Calculate the norm of value
copy/paste your result to any other application
provide many other scientific functions
Press “Command”+”Shift”+”4” to have screen capture and export your graph.
You can refer to gnuplot commands list for data plot
It is very simple and easy to use.
Functions in scientific graphing calculator:
it can plot f(x), f(x,y) based on your define, such as f(x) = x**2+2*x+1
The following math functions you can use to plot 2D and 3D Graph:
abs(x) absolute value of x, |x|
acos(x) arc-cosine of x
asin(x) arc-sine of x
atan(x) arc-tangent of x
cos(x) cosine of x, x is in radians.
cosh(x) hyperbolic cosine of x, x is in radians
erf(x) error function of x
exp(x) exponential function of x, base e
inverf(x) inverse error function of x
invnorm(x) inverse normal distribution of x
log(x) log of x, base e
log10(x) log of x, base 10
norm(x) normal Gaussian distribution function
rand(x) pseudo-random number generator
sgn(x) 1 if x > 0, -1 if x < 0, 0 if x=0
sin(x) sine of x, x is in radians
sinh(x) hyperbolic sine of x, x is in radians
sqrt(x) the square root of x
tan(x) tangent of x, x is in radians
tanh(x) hyperbolic tangent of x, x is in radians
___________________________________________________________
Bessel, gamma, ibeta, igamma, and lgamma functions are also supported
Support data plot functions for gnuplot commands
Please check the sample on http://gnuplot.sourceforge.net/demo_4.6/