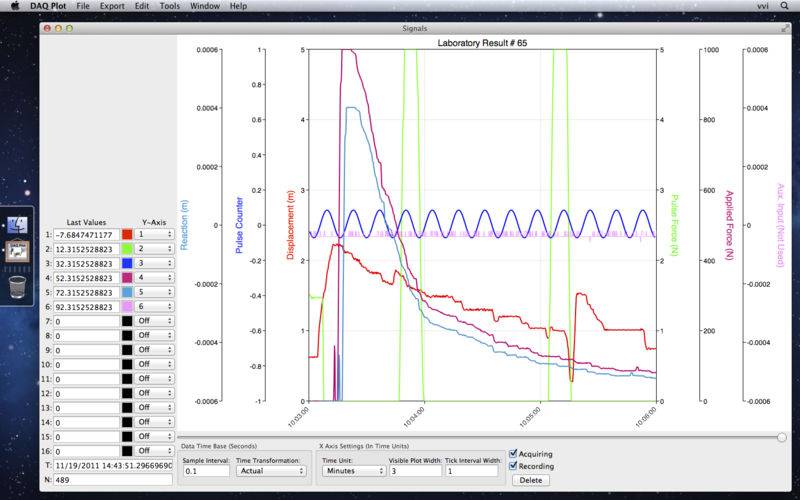
DAQ Plot is a strip chart application for real-time viewing and analysis of signals. Use simulated signals to understand data logging concepts without additional hardware, the microphone built into the Mac to acquire acoustic signals and the inexpensive DLP-IO8-G data acquisition hardware (purchased separately) to measure up to eight voltage signals.
DAQ Plot and DLP-IO8-G hardware is perfect for laboratory settings based on Mac computers because the cost-effective combination permits each experimenter to have their individual signal recording station. Because it uses the built-in drivers on the Mac, it is easy to install and administer. DAQ Plot is real time so experimenters see intuitive graph results immediately which makes learning that much easier and makes it fun for an inquisitive mind to play around with.
DAQ Plot has been used for over a decade at many commercial laboratories, universities, industries and by engineering consultants. It is used for everything from quick-and-dirty experiments to serious needs such as 24/7 power utility company monitoring and has been called an indispensable tool by its users. Because of its well-engineered, multi-threaded, multi-buffered implementation it can display seconds to years worth of data in real time while simultaneously acquiring and displaying new data.
DAQ Plot is designed to be easy to use and intuitive and at the same time gives advanced users access to more powerful features when desired.
FEATURES
• Many types of signal sources: Simulated (requires no hardware), microphone (requires a microphone) and the inexpensive DLP-IO8-G data acquisition hardware (purchased separately).
• To purchase the DLP-IO8-G and for additional hardware options contact VVI or see an online retailer.
• Advanced features such as spectral analysis and built-in filters to perform counting, averaging, integration, differentiation and other transforms.
• Signal display can be altered using a variety of graphical effects and signal values can be exported in many ways.
• DAQ Plot is intended to be simple to use and also implements progressive complexity to satisfy advanced users.
• Its design is multithreaded and modular for robustness and scalability.
• Includes advanced features such as one to sixteen y-axis graph presentations to features you expect like easy to use printing.
• The manual, included with DAQ Plot, contains reference material, tutorials, support sections and other descriptions including where to get hardware and the concepts of strip chart analysis.
• Performance limited to hardware and other specifications. Consult the manual for details.
SUPPORT
DAQ Plot includes a comprehensive manual. The manual is also online at www.vvidget.org. For additional support email support@vvi.com.