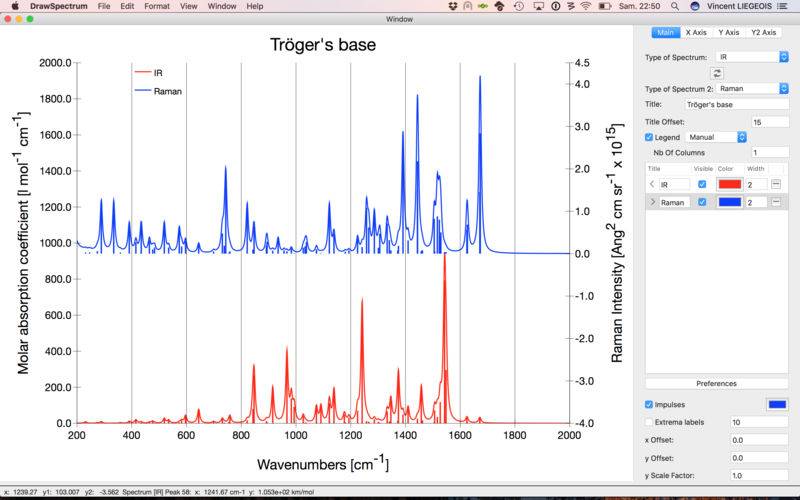
DrawSpectrum, a powerful graphical interface to plot Infrared, Raman, Vibrational Circular Dichroism (VCD), Raman Optical Activity (ROA), Sum-Frequency Generation (SFG), UV-Vis, and Electronic Circular Dichroism (ECD) spectra obtained form quantum chemistry calculations as well as from experiment.
CITATION
If you use DrawSpectrum for your scientific work, please cite the DrawSpectrum program in your papers:
DrawSpectrum, Vincent LIEGEOIS, UNamur, www.unamur.be/drawspectrum
All papers that cite DrawSpectrum will be listed on the website
FUNCTIONALITIES
With DrawSpectrum, you can:
A) Plot Infrared, Raman, Vibrational Circular Dichroism (VCD), Raman Optical Activity (ROA), Sum-Frequency Generation (SFG), UV-Vis, and Electronic Circular Dichroism (ECD) spectra obtained form quantum chemistry calculations as well as from experiment.
B) Show the contribution of each transition (for IR, Raman, ROA, VCD, UV and ECD coming for quantum chemistry calculations) to the global spectrum via impulses.
C) Add a label on each maximum of the plot, move and rename these labels.
D) Quickly zoom and drag the plots by using the trackpad
E) Save any spectra:
– As a picture in pdf (vectorial)
CONTACT AND HELP
If you have any issue, please send an e-mail at drawmol@unamur.be