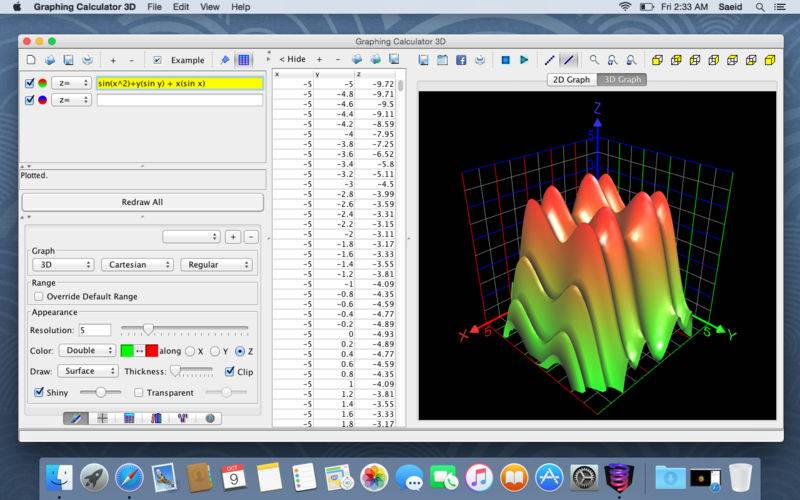
Plot high quality graphs of mathematical equations and data with this easy-to-use software. To plot a function simply type it down and the graph will be updated instantly after each keystroke. Its rich set of features include:
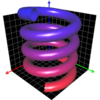
– Plot 2D & 3D functions
– Plot implicit equations
– Plot parametric equations
– Plot inequalities
– Plot 3D scatter points
– Plot contour graphs
– Generate tables of values
– Cartesian coordinates
– Polar coordinates
– Cylindrical coordinates
– Spherical coordinates
– Import csv & excel coordinates
– Import live data coordinates
– High precision computations
– 3D shading & glass effects
– Fast rotation & graph animations
– Simultaneous multiple graphs
– Define your own variables
– Change value of variables via sliders and see their effects on graphs
– Define your own functions (including recursive functions)
– Save graphs as high-resolution 3000×3000 pixel images
– Animate graphs