Bring your data to life! Create line graphs, scatter plots, bar graphs, bubble graphs, tables, and more, to communicate with your audience and get your point across.
Built-in styles and color schemes help make your charts look great—whether you’re presenting them, printing them, or publishing them online. You can create multiple views of your data, or combine graph types and include information from multiple datasets in a single chart.
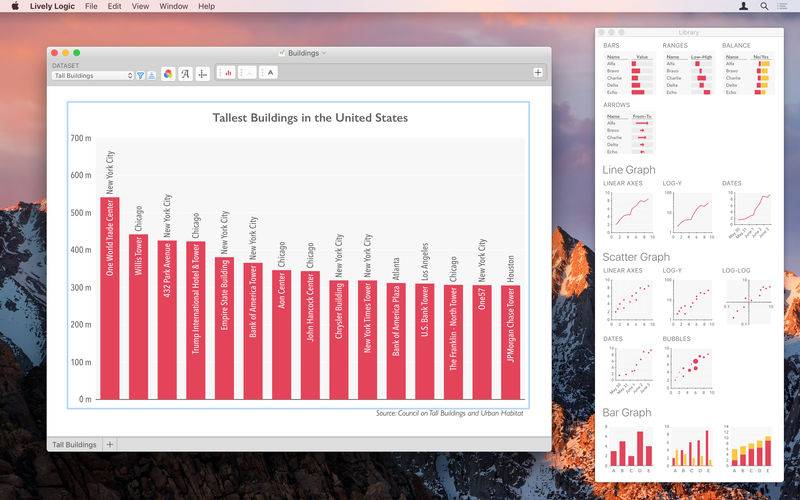
• Create your graphs in seconds. The inspector bar gives you quick control over the content and appearance of your charts.
• Graph axes automatically scale to fit your data—or you can move or resize them by dragging.
• Change the look of your graphs with a single click with the built-in font collections and color schemes.
• Explore different views by swapping one data field for another. You can pick fields by name, so it’s easy to get the right one.
• Focus your audience’s attention by adding labels or highlighting important values. Illustrate trends or relationships using best-fit curves. And make your tables more compelling by adding checkmarks, bars, or bubbles.
• No more obsessing over row/column coordinates. No more hunting for the formula that broke when you moved a column or added a row. You identify your dataset fields by name—not by letter. And formulas apply to entire fields—not individual cells. So all your calculations and charts update automatically, any time you make a change or add new values to your dataset.
• Import or export CSV files. Save graphs and charts as JPEG, PNG, SVG, or PDF files, or copy & paste them into other Mac apps.