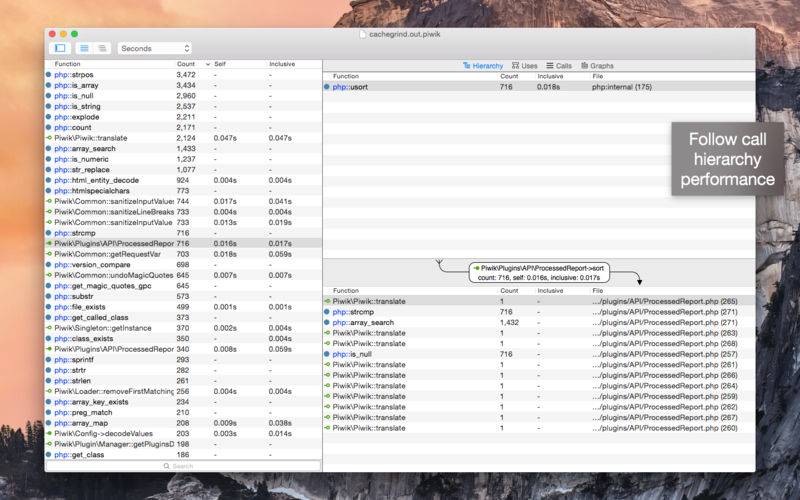
MCG lets you analyse your application profile data natively on your Mac.
With call tracing and function summaries, you’ll easily be able to detect and correct any parts of your application that are taking longer than they should.
MCG requires callgrind data for your application, which can be generated in many languages such as PHP, Ruby and Python, or can be baked in for compiled languages.
FEATURES:
• Super fast parsing of most callgrind files, regardless of language.
• Structural analysis graphs including call depth, class methods call count and cost, and function type.
• Supports compressed callgrind and multi–profile files (supported by Xdebug 2.3+)
• Various treemap visualizations for MCG’s Outline and Flat data modes, including heat map gradients (please read app help for why treemaps aren’t accurate in profiling tools)
• Outline call tree view for PHP Xdebug shows exact execution path/tree.
• Click navigable to follow calls, treemap nodes and graph points.
• Text search filter.
• Generic cost support, including Seconds, Milliseconds and Microseconds for time costs, and MB/KB/b for memory.