Race Analysis allow you to analyse your race log in a very simple way.
Import your race data in the CSV (comma seperated value) file from your navigation software (Deckman or Expedition).
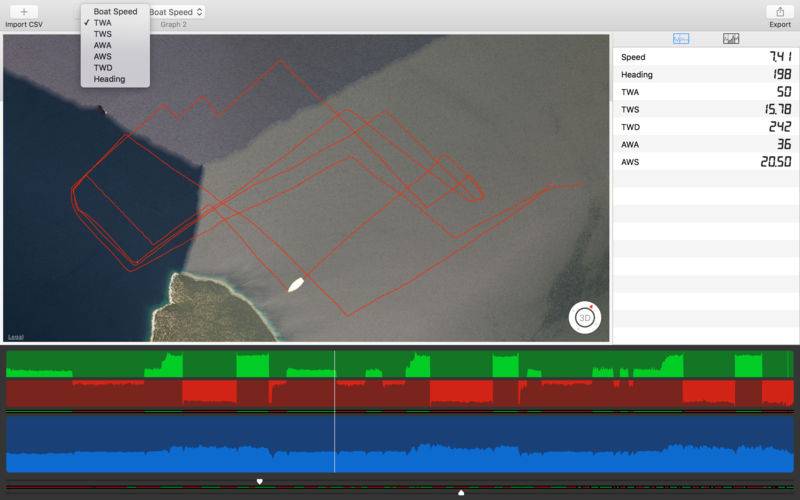
Select the variables pair from dropdown menu to plot the graphs which you want to compare.
Race Analysis has 3 different way for plotting a graph.
Relative angle plot is for TWA or AWA in order to analyse different tack. absolute angle plot and speed plot.
Absolute angle plot is for TWD or Heading,
Speed plot is for Boat Speed, TWS or AWS.
When you move your cursor on the graph you can follow boat position on the map and all variables on the rigth panel. How they are changing instantly.
If you click down on the graph you pinned the cursor. if you pinned second time; Race Analysis calculates the Avarage Values, distance duration tack count and jibe count between the pinned cursor. And add them in to the table. You cab change the slice name for ex. Race 1, 1. Leg or 1. Upwind for memorize later. You can delete unnucessary Values and Exoprt them as a repot.