Sigma is a powerful statistical software everyone can use. Analyze your data and plot it.More than 15 H-Test method,18 types of probability distribution.
+ Probability Distributions
Normal, Chi Square, F, T, Uniform, Poisson, Geometric, Negative Binomial, Hypergeometric, Beta, Cauchy, Exponential, Gamma, LogNormal, Logistic,
Wilcoxon, Weibull, Wilcoxon Rank Sum Statistic.
+ Plots
– Scatter Plot
– Line Plot
– Radar Plot
– Pie Plot
– Bar Plot
– Box Plot
– Graph Plot
– Normal And Chisquare Distribution Plot
+ Special Plots
– Stem And Leaf
– Pareto
– Histogram
– Facet Scatter
– Facet Bar
– Facet Line
– Facet Pie
– Facet Area
– Jitter Point
– Nightingale Rose
– Bubble
– Scatter Matrix
+ Hypothesis Tests
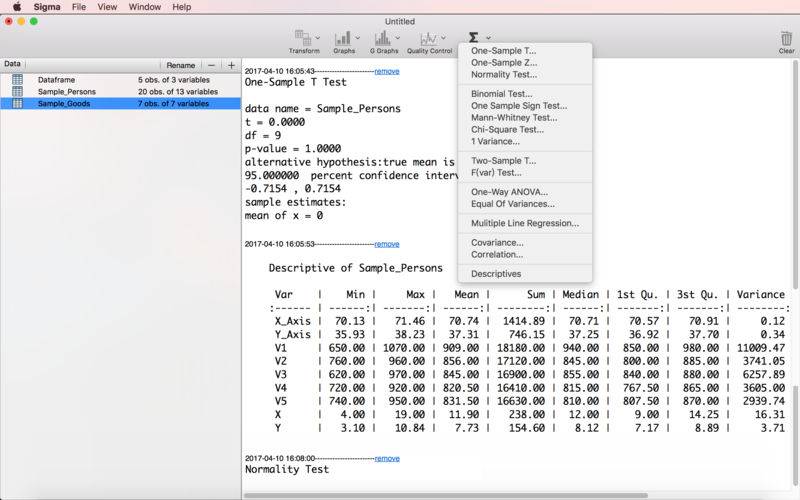
– Normality Test (Anderson Darling, Jarque-Bera, Shapiro- Wilk)
– One-Sample T Test
– Two-Sample T Test
– One-Sample Z Test
– Chi-Square Test
– Mann-Whitney U Test
– One Sample Sign Test
– One Variance
– F(Var) Test
– Binomial Test
– Kolmogorov–Smirnov Test
– One-Way ANOVA
– Two-Way ANOVA
– Levene Test
– Bartlett Test
– Flinger Test
– Multiple Line Regression
– Binary Logistic Regression
– Correlation Matrix And Correlation Test(Pearson and Spearman)
– Covariation Matrix
– Two Sample Z Test
– Two Proportion Z Test
– Two Sample Sign Test
+ Control Charts
– Xbar Chart
– R Chart
– S Chart
– Xbar.One Chart
– P Chart
– NP Chart
– U Chart
– C Chart
Online Help:http://www.tyevolution.com/nr.jsp?_np=0_315_17