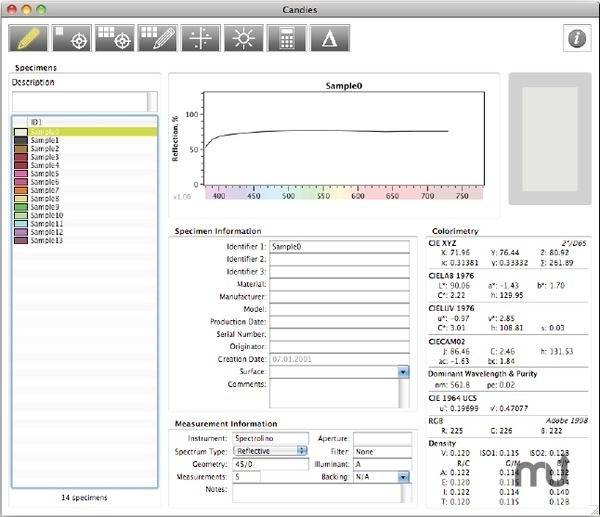
SpectraShop is a program for measuring, analyzing and storing visible light spectra. It can measure spectra directly with various instruments, or import data from other programs. Spectral data can also be exported in several formats. In addition to individual specimens, SpectraShop has a very flexible chart definition and measurement feature. An impressive array of colorimetric values are displayed for each spectrum. Easy to use tools are provided for analyzing and visualizing spectral and colorimetric data. This version has unique features unavailable in other programs: Instant Difference, to calculate the differences between two specimens as they are selected; and Instant Average, which averages multiple specimens in the same way, instantly! This is a fantastic version with lots of great new tools, along with enhancements to your existing ones. All the tools are designed to be powerful, yet easy to use. Tools in SpectraShop 5: Measure Specimens Tool: Emissive light, emissive monitor, reflective, transmissive Emissive flash with i1 Pro Flexible auto-naming feature Measure Graph Tool: Emissive light, emissive monitor, reflective, transmissive graphs Rectangular graphs Arbitrary graphs (e.g. OECF) Define Graph Tool: Create emissive monitor, reflective or transmissive graphs definitions Rectangular graphs Arbitrary graphs Graphs saved as editable text files Graph 2D Tool: Graphs of any colorimetric value against any other Gamut graphs Paired graphs of color changes, with or without direction arrows TRC curve graphs Graphs are of publication quality Graphs can be exported to a file or printed Lighting Tool: CRI General Rendering Index CRI Special Rendering Index CQS New color index from NIST CQS Gamut Area Index Simulated sample patches for CRI and CQS ∆Eab values for all patches Export CRI and CQS values to a text file Calculate Tool: Add, subtract, multiply and divide up to 4 lists of specimens Normalize and scale specimens Useful for creating various spectral interactions Difference Tool: Calculate differences from a single reference (good for QA/QC work) Compute differences between two paired lists (great for comparing two charts) ∆Eab, ∆E94, ∆ECMC, ∆E2000 Pass/Fail indicators Difference spectral graph Differences of more than 20 colorimetric values Note: upgrade pricing can be viewed here.