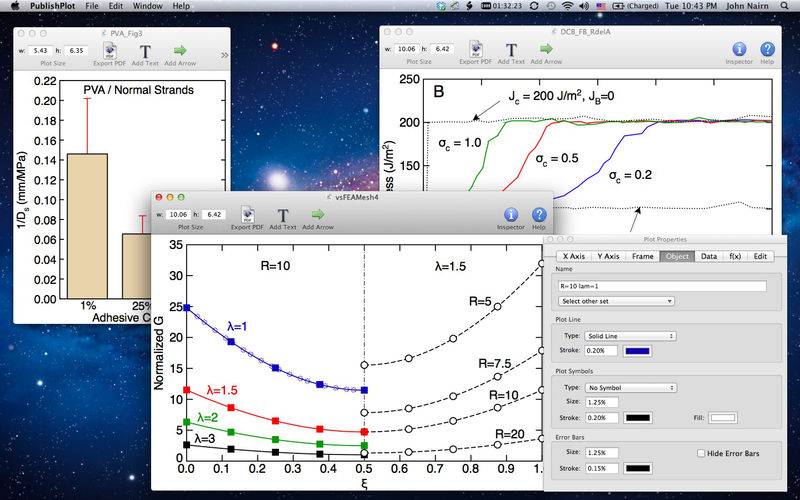
The goal of PublishPlot is to quickly create publication quality plots from any text-based table of data. It is developed by a professor and editor for an international journal who wanted to create good plots and was tired of rejecting papers that had ugly plots (especially standard plots created by Microsoft Excel). PublishPlot is ideal for students, teachers, professors, scientists, and engineers. You start with a table of data (such as cells in a spread sheet document or output from custom software) and then copy and paste, or drag and drop, to a PublishPlot window. You will immediately have a high-quality plot. You can customize the initial plot settings in the preferences or customize all features of a plot after it is created. You can add error bars as well as plot annotations such as text labels and arrows. When ready to use a plot, drag it as a PDF to another application or to a file on your desktop.
A unique feature of PublishPlot is that you never set absolute size of plot elements. Instead, all plot features are sized relative to the size of the plot. This approach mimics the way illustrators used to draft plots before using computers. For example, one design rule-of-thumb is to have plot symbols be 1-2% of the plot diagonal. Similarly in PublishPlot, all size settings are done as a percent of the plot diagonal rather than a fixed size. Even when setting font sizes in points, you are really setting a “virtual” font size that gives the actual size for a full-page, landscape-mode plot (i.e., about a 10 inch diagonal plot), but scales it for other plot sizes. This approach is ideal when resizing plots to fit in space provided by your publication needs.
PublishPlot is a scriptable application and can be controlled by writing AppleScript or Python scripts. Those that are developing their own custom software or scripts can use this feature to provide plotting support for those custom tools. PublishPlot has built-in tools for simple data transformations and selected fitting functions. By writing scripts, however, transformations and fits can be developed for any custom needs. PublishPlot lets you plot any basic function of x. Alternative, a script could be developed to plot more complex functions.
You can edit plot data right in PublishPlot, but those features a basic (by design). The intent of PublishPlot is as a post-processing tool for plotting data created in other software, stored in spread sheet documents, or saved in plain text files. This need is common for scientists, engineers, and other academics who might obtain data by a variety of methods. Normally you return to the originating tool to edit the data rather the use the built-in PublishPlot methods.
If you want great plots and you want them fast, PublishPlot might the tool for you.