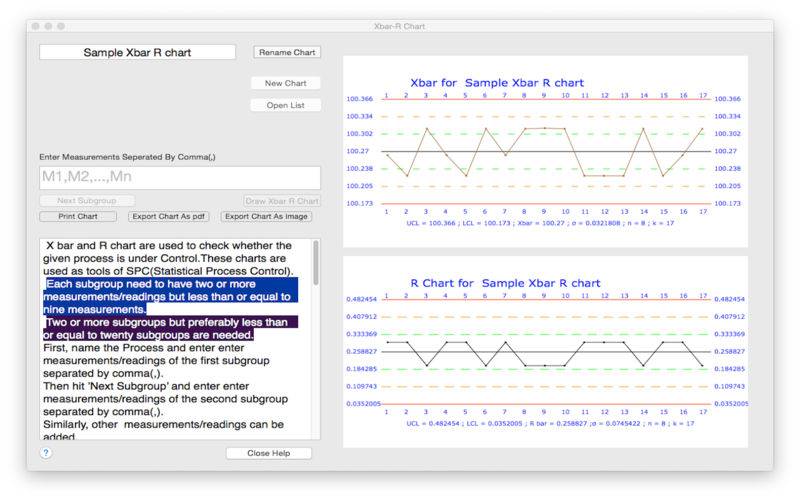
X bar and R chart are used to check whether the given process is under Control.These charts are used as tools of SPC(Statistical Process Control).
Each subgroup need to have two or more measurements/readings but less than or equal to nine measurements.
Two or more subgroups but preferably less than or equal to twenty subgroups are needed.
The following points on x bar chart indicates out of control(SPC) process:
a. one point outside the 3 sigma control limits
b. eight successive points on the same side of the centre line
c. six successive points that increase or decrease
d. two out of three points that are on the same side of the centre line,
both at a distance exceeding 2 sigma’s from the centre line
e. four out of five points that are on the same side of the centre line,
four at a distance exceeding 1 sigma from the centre line